The new iPad launch (that is the iPad 3) was launched at 11am PT on Wednesday 7 March.
The new iPad that grabbed the headlines not only on conventional newswires but also on Twitter. In this blog, we examine how users on the social media network Twitter reacted to the announcement. We have collected data over a four day period commencing the 6th of March using our Twitter probe for the hash tags #ipad and #apple. We have also applied a sentiment score to each tweet to determine whether the users are positive or negative about the launch.
We have analysed our findings using Qlikview. If you wish to obtain a copy, then please email us at support(at)albatrosa.com
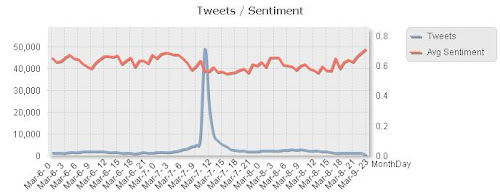
In total, we collected 267,000 tweets. The average number of tweets per hash tag is approximately 500 to 1000 per hours. This has increased to 27,000 at the time of the announcement and then sharply dropped back to the daily average the following day.

We have analysed the number of tweets and corresponding sentiment over time. Scores of 1 and -1 represent a positive and negative sentiment respectively. Leading to the announcement, the sentiment score edged slowly up to 0.67 as the hype built up but then dropped to its lowest level (0.56) as the announcement was made. It appears that the fans reacted less favourably to the announcement. The sentiment score recovered slowly back to 0.7 two days following the announcement. The loyal apple fans appear to be contempt with the new iPad, for now at least.

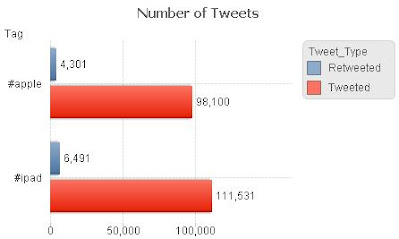
The following figures provide a mode detailed breakdown of the tweets. On average 6% of tweets were retweeted. This is a much higher then Twitter’s average and indicates a very high level of engagement among tweeters.

Positive tweets outnumbered negative ones by 4 to 1. Apple must be pleased with this result. No doubt there will be very long queues on launch date and fans will want to get their hands on a new iPad.

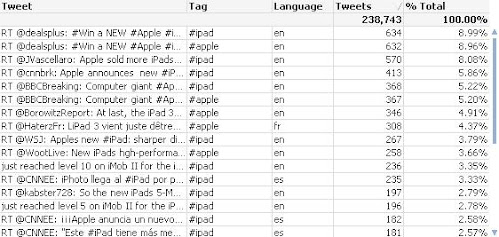
Top tweeters and top tweets are given in the following two figures


