Obama and jobs in the US are in deep focus this week. So, how has US unemployment faired under this president?
Employers have added no new jobs on balance in August, and the unemployment rate is stuck at 9.1%. No US president since FDR has won an election with unemployment that high.
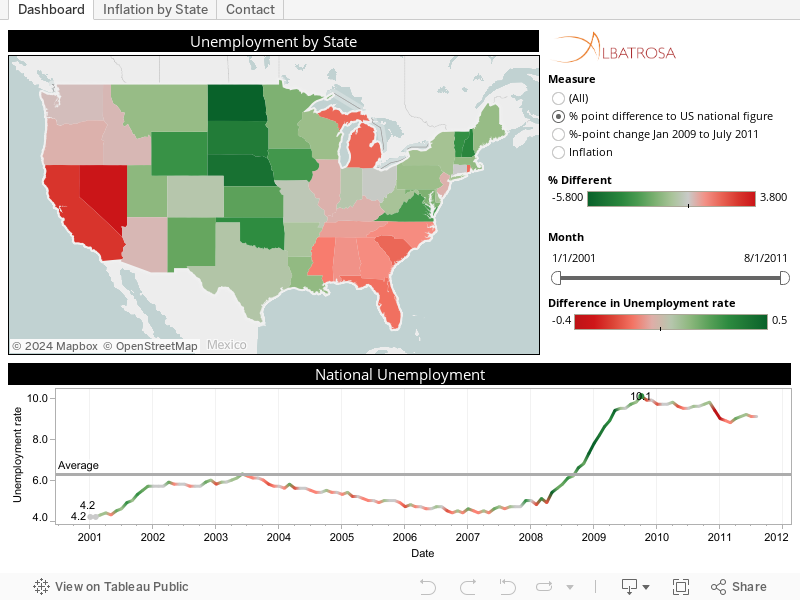
Since 2001, US unemployment averaged 5.2% (4.2% min and 6.3% max). Since April 2008, it has risen sharply from from 4.9% to 10.1% in in October 2009. It has since inched on a downward trend.
On a state level, Nevada is the worst hit with an unemployment rate of 12.9% followed by California at 12%. By contrast, North Dakota has the lowest rate at 3.3% followed by Nebraska at 4.1%.
We’ve mapped the unemployment data by state – you can explore it here:
For further details, visit www.albatrosa.com